| Fig-1_Temp
Surface temperature from 1860 until
2000 shows an overall rise of 0.9°C. The future projections are following CO2
emissions and atmospheric ghg
concentrations (in ppmv - parts per
million by volume).The red line shows
Business-as-Usual (BAU) where the
underlying emissions grow at 2%/yr.
The blue line shows the lowest possible
climate sensitivity - a rise of 1.5C -
assuming a contraction by 2100 of 60%
in annual emissions. The future projections are following CO2
emissions and atmospheric ghg
concentrations (in ppmv - parts per
million by volume).The red line shows
Business-as-Usual (BAU) where the
underlying emissions grow at 2%/yr.
The blue line shows the lowest possible
climate sensitivity - a rise of 1.5C -
assuming a contraction by 2100 of 60%
in annual emissions. |
| |
| Fig-2_CO2-concentration
Recorded atmospheric Co2
concentration from 1860 until 2000 shows an increase of 34% over pre-
industrial levels.This is a rise both
higher and faster than anywhere in the
ice-core sampling back 440,000 years
before now. Concentrations are rising as
the result of accumulating emissions. In
future, the worst case is the red line as
BAU.The best case sees this
concentration stabilised at 70% above
pre-industrial levels due to a 60%
contraction in the underlying emissions
by 2100.
 |
| |
| Fig-3_DamageCost
Damages here are the global uninsured
economic loss estimates (Munich Re) for the four decades past for all natural
disasters projected at the observed rate
of increase of 12% a year in comparison
to global $GDP at 3%. If these global
trends continue BAU, damages will
exceed GDP by 2065! The risks will soon
rise beyond the capacity of the
insurance industry and even
governments to absorb. Damages will
rise for the century ahead even with
emissions contraction, but the rate can
be reduced with Contraction,
Convergence, Allocation and Trading (C-CAT).
 |
| |
| Fig-4_perCapAllocation
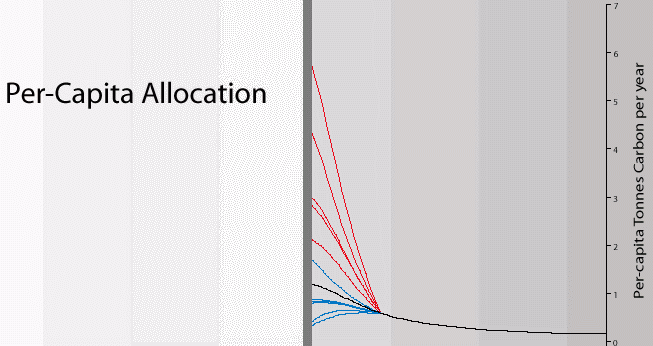
The regional per capita emissions traces shown below are the result of the
convergence rate being set at global
convergence by 2050.
Different rates of convergence (faster or
slower) might be negotiated.
What is shown is the allocation of
tradable permits emissions per capita
with convergence complete by 2050.
These do not necessarily reflect
emissions per se. Subject to the overall
C&C arrangement and depending on
the extent of permit trading, the
realised fossil fuel consumption
patterns might be noticeably different.
 |
| |
| Fig-5_ renewablesOpportunity
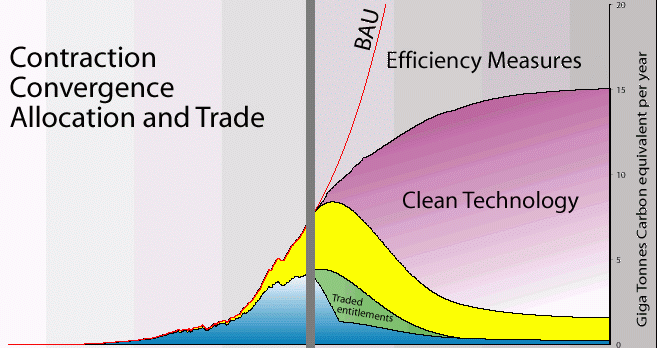
The red line shows BAU CO2 emissions. The solid segments show "Contraction,
Convergence, Allocation and Trade" [C-
CAT] to manage emissions down by at
least 60% within a given time frame
(2100 here) with an agreed 'contraction
budget' (here 680 billion tonnes of
carbon).The internationally tradable
shares of this budget (eg 100 billion
tonnes) result from convergence to
equal per capital emissions by an
agreed date and population base year
(here 2020).The renewables
opportunity is the difference between
C-CAT and BAU.Worth trillions of dollars
per annum, it is the biggest market in
history.
 |
| |
| Fig-6_Byrd-Hagel-Resolution
In June 1997, the US Senate passed the
Byrd Hagel Resolution by 95 votes to 0. “The US should not be a signatory to
any protocol to, or other agreement
regarding, the UNFCCC of 1992, at
negotiations in Dec.‘97, or thereafter,
which would mandate new
commitments to limit or reduce
greenhouse gas emissions for the
Annex I country Parties, unless the
protocol or other agreement also
mandates new specific scheduled
commitments to limit or reduce
greenhouse gas emissions for
Developing Country Parties within the
same compliance period.”
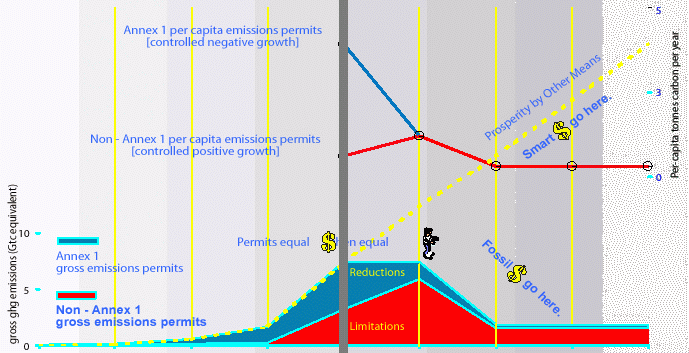
C&C is consistent with this. As shown
here. the two defining distinctions are
maintained.The 1st between the Annex
1Parties and the Developing Country
Parties; the 2nd between 'limit' ghg
emissions and 'reduce' ghg emissions.
Limitation means controlled positive
growth and reductions means
controlled negative growth.Together
"within the same compliance period",
the paragraph translates into a process
of "Contraction & Convergence". Annex
1 Parties reduce emissions while the
Non Annex 1 Parties limit their
emissions thus converging with Annex One. |
| |
| Fig-7_Oil-Depletion
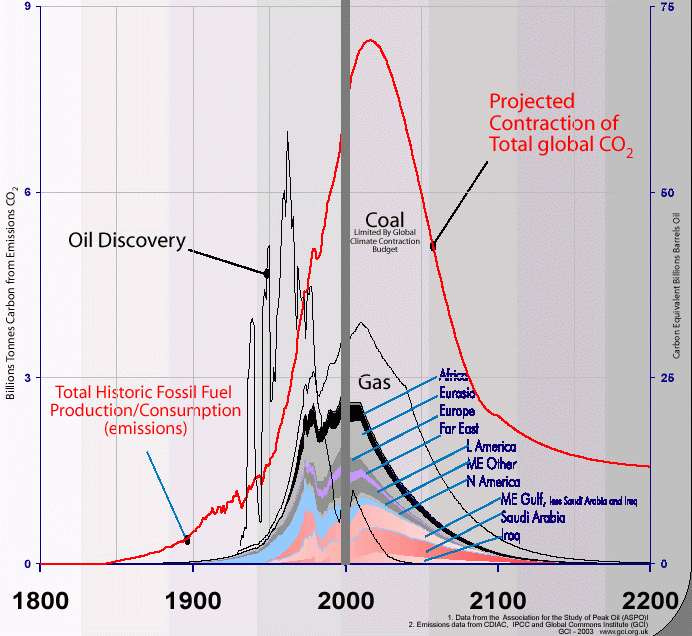
Shown alongside here in barrels and
tonnes carbon is the: - (1) peak of oil discovery in the 1960s (as
published by EXXON in 2002) and
(2) peak of crude oil production as
modeled by members of the
Association for the Study of Peak Oil
(ASPO) and
(3) where past and future reserves lie -
the West is now past peak with two
thirds proven reserves in the Gulf
Middle East. This is based on data from
Petro-Consultants as published by
ASPO and,
(4) ASPO’s projected global gas
depletion rate and,
(5) the amount of coal that is required
to make the total tonnage of carbon
emitted consistent with the IPCC
Working Group One projection of a
future where atmospheric
concentration of CO2 rises no higher
than 450 ppmv (as shown above).
|